An OpenAI-published generated browser tool that reads a CSV file and configures bar, line, pie or doughnut charts with column mapping, colors and PNG download logic.
ShowcaseWeb
What can you do with it?
Inspect a generated file-to-chart workflow: local FileReader input, header/delimiter controls, numeric-column selection, chart/color changes and a canvas-to-PNG download handler.
What should you know before using it?
A separate browser observation covers the built-in sample, chart-type change and dataset visibility. File import and PNG output are unverified. Chart.js loads from an unversioned CDN. Source inspection shows empty strings become zero and commas are stripped; invalid numbers are skipped in pie/doughnut charts or become gaps in bar/line data. Analytical correctness and CSV compatibility were not established.
What is verified here?
Creator: OpenAI
OpenAI attributes the application collection to single GPT-5 or GPT-5.2 prompts without handwritten application code; the exact example manifest has no model-checkpoint field. The generated application uses the separately authored Chart.js library, so the authorship claim does not extend to that dependency.
Runtime: Single HTML application with an embedded sample and file picker/dropzone, without paste-text input. Source inspection shows local FileReader parsing and a PNG data-URL handler. A later browser check used only the built-in sample; Save as image was clicked, but download completion was not verified.
License note: Repository application code is MIT; Chart.js is separately MIT-licensed. The application does not pin the Chart.js version served by the CDN. Upstream license ↗
This entry combines original-source review with the limited browser observations below. Other features and research results have not been independently verified. AI-development claims remain author-reported; consult upstream for versions, setup and licenses.
Resource type
Software made with AI
Provenance
AI-built, author-reported
Reviewed
Platforms
Web
Browser observations
These are limited interactions with a public demo on a stated date. They do not verify the whole application or establish which source commit was deployed.
· Chrome on macOS · desktop · publisher sample · no account
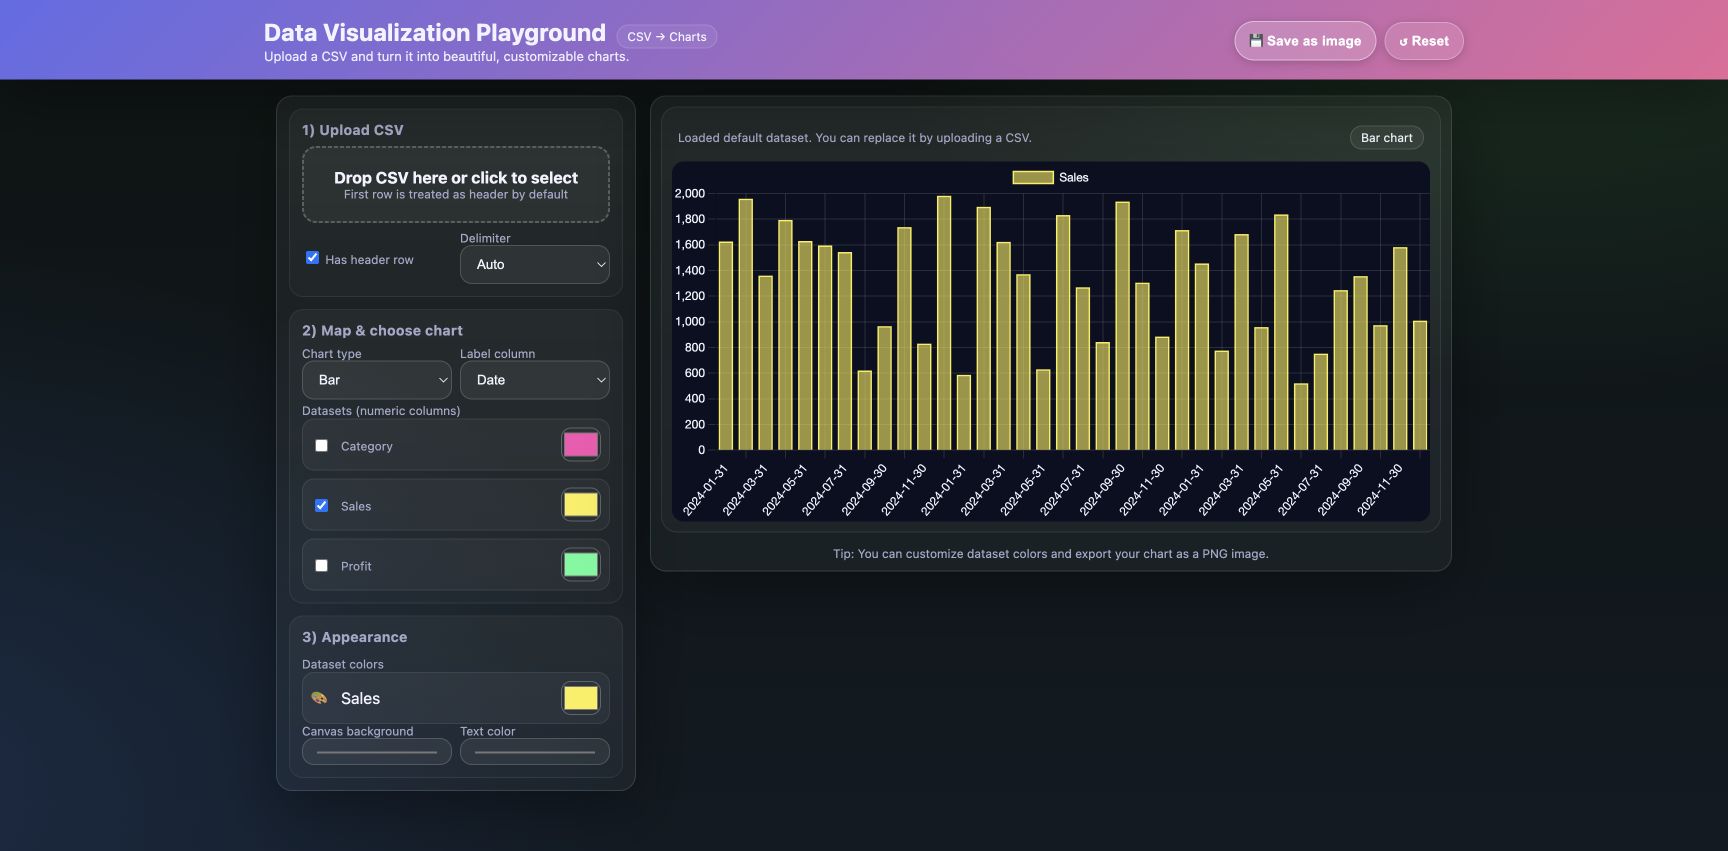
The sample changed from a two-series line chart to a Sales-only bar chart.
A default dataset loaded, with a line chart showing Sales and Profit.
Select Bar in Chart type.
The control and chart label changed to Bar; the visible chart used vertical bars.
Uncheck Profit while leaving Sales selected.
Profit disappeared from the chart legend and the color controls; Sales remained visible.
Click Save as image.
The button was activated, but completed file creation was not verified. The page continued to show the same bar chart.
Scope and limits: This covers chart-type and dataset-visibility controls on the publisher’s built-in sample. No file was uploaded, and CSV parsing, numeric correctness, colors, pie/doughnut modes and mobile behavior were not tested. PNG export remains unconfirmed; a download-observation timeout alone does not prove an application failure.
Observed Sales-only bar chart using the embedded sample. Demo published by OpenAI; chart rendering uses Chart.js.